PESTLE analysis without the checkbox theater
Guide · Frameworks · 5 min read · last verified 2026-08-11
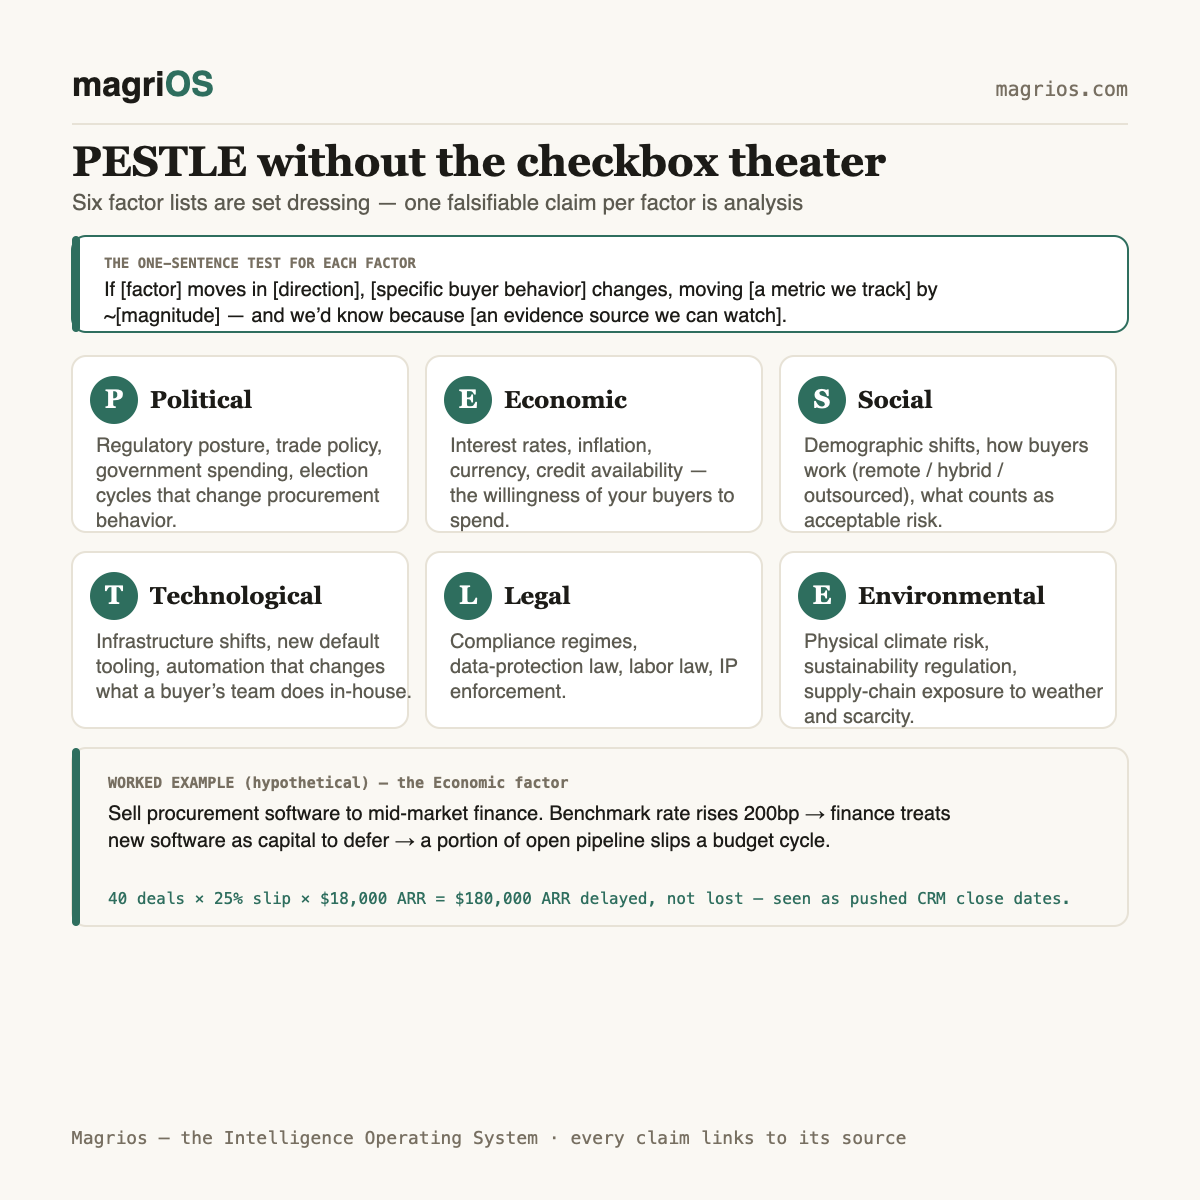
Most PESTLE write-ups you'll find are a listing exercise dressed up as analysis: six headers, six bullet lists of macro trends copied from the top of a search result, presented once in a slide deck, and never touched again. That's checkbox theater. It produces the appearance of rigor — every letter has content under it — without the one thing that makes an environmental scan worth the time: a claim about your business that could turn out to be wrong.
What the six letters are actually for
PESTLE stands for Political, Economic, Social, Technological, Legal, and Environmental — six categories of forces outside your company that can move your numbers without you touching your product or your pricing.
- Political: regulatory posture, trade policy, government spending priorities, election cycles that change procurement behavior.
- Economic: interest rates, inflation, currency movement, credit availability, the general willingness of your buyers to spend.
- Social: demographic shifts, changes in how buyers work (remote, hybrid, outsourced), shifts in what's considered acceptable risk.
- Technological: infrastructure shifts, new default tooling, automation that changes what your buyer's team can do in-house.
- Legal: compliance regimes, data protection law, labor law, IP enforcement.
- Environmental: physical climate risk, sustainability regulation, supply chain exposure to weather and resource scarcity.
None of that is controversial. The category list is not where PESTLE goes wrong.
Where it actually breaks
It breaks at the translation step — the step most teams skip. A generic trend ("interest rates may rise") is not an insight. It becomes one only when you can say what it does to a number you track. Most PESTLE exercises stop one sentence short of that, because finishing the sentence requires knowing your own business well enough to model it, and writing "interest rates may rise" is faster than doing that work.
The tell is a PESTLE grid nobody owns. If no single person on the team is accountable for a factor turning out to be right or wrong, it isn't analysis — it's set dressing for a strategy doc. It gets built once, presented once, and filed in a drive nobody opens again until next year's planning cycle, when someone rebuilds it from scratch because the old one taught nothing.
The fix: one falsifiable claim per factor
Replace each bullet with a single sentence in this shape:
"If [factor] changes in [direction], then [specific buyer behavior] changes, which moves [a metric we actually track] by roughly [magnitude], and we'd know it was happening because [an evidence source we can actually watch]."
If you can't complete that sentence for a factor, you don't have an insight yet — you have a headline. Cut it or keep researching. A six-row grid where four rows are real claims and two are honest blanks is more useful than a six-row grid where all six are padding.
This also fixes ownership. A claim tied to a specific metric and a specific evidence source has a natural owner: whoever already watches that metric. Political risk affecting your renewal timing belongs to whoever owns the renewal pipeline. A technological shift affecting build-vs-buy belongs to whoever owns competitive positioning. The grid stops being an orphaned document and becomes a set of hypotheses distributed across people who already have a reason to check them.
Worked example (hypothetical)
Say you sell procurement software to mid-market finance teams, and you're testing the economic factor: a rise in interest rates.
The claim: "If the benchmark rate rises 200 basis points, finance teams treat new software as capital they'd rather not commit, and a portion of our open pipeline slips a budget cycle instead of closing on the quarter we forecasted, which shows up as pushed close dates in the CRM, not lost deals."
Now the arithmetic — this is a hypothetical model to illustrate the method, not a real dataset:
- Open pipeline: 40 deals
- Average contract value: $18,000 ARR
- Assumed slip rate under the scenario: 25% of deals push one quarter
- Deals affected: 40 × 0.25 = 10 deals
- ARR affected: 10 × $18,000 = $180,000 ARR delayed, not lost
That $180,000 is not a forecast — it's what the claim implies if the assumed 25% slip rate holds. The number's only job is to tell you whether the factor is big enough to act on. If the honest range were "$20,000 of ARR, maybe," it wouldn't deserve a mitigation plan. Because it's a quarter of the open pipeline, it deserves one — probably an early conversation with finance-team champions to lock budget before the rate decision lands, and a CRM field to tag deals as "rate-sensitive" so you can watch the claim resolve in real close-date data instead of guessing again next quarter.
Running it without lying to yourself
Three habits separate a PESTLE that teaches you something from one that just exists:
- Revisit on a cadence, against actuals. Quarterly, pull up last quarter's claims and check what actually happened to the metric each one named. Most will be wrong in magnitude even when right in direction — that's fine, that's the point of tracking it.
- Kill claims that never resolve. If a factor sits on the grid for three cycles with no evidence either way, it wasn't a real claim — it was a hedge. Remove it.
- Keep the evidence source cheap to check. If checking a claim requires a research project, you won't check it. Tie claims to things you already have a dashboard for: close dates, support ticket volume, win-loss notes, churn cohorts.
When PESTLE is the wrong tool
If you're pre-product-market-fit with a handful of customers, macro forces are not your binding constraint — product-market mismatch is, and it will drown out any signal from interest rates or regulation. PESTLE earns its keep once you have enough scale and enough historical data that a macro shift is plausibly large enough to move the P&L more than normal quarter-to-quarter noise does. Below that scale, spend the hour on customer interviews instead.