Stacked SAFEs dilute founders far more than the cap table suggests
Guide · Founder · 6 min read · last verified 2026-08-11
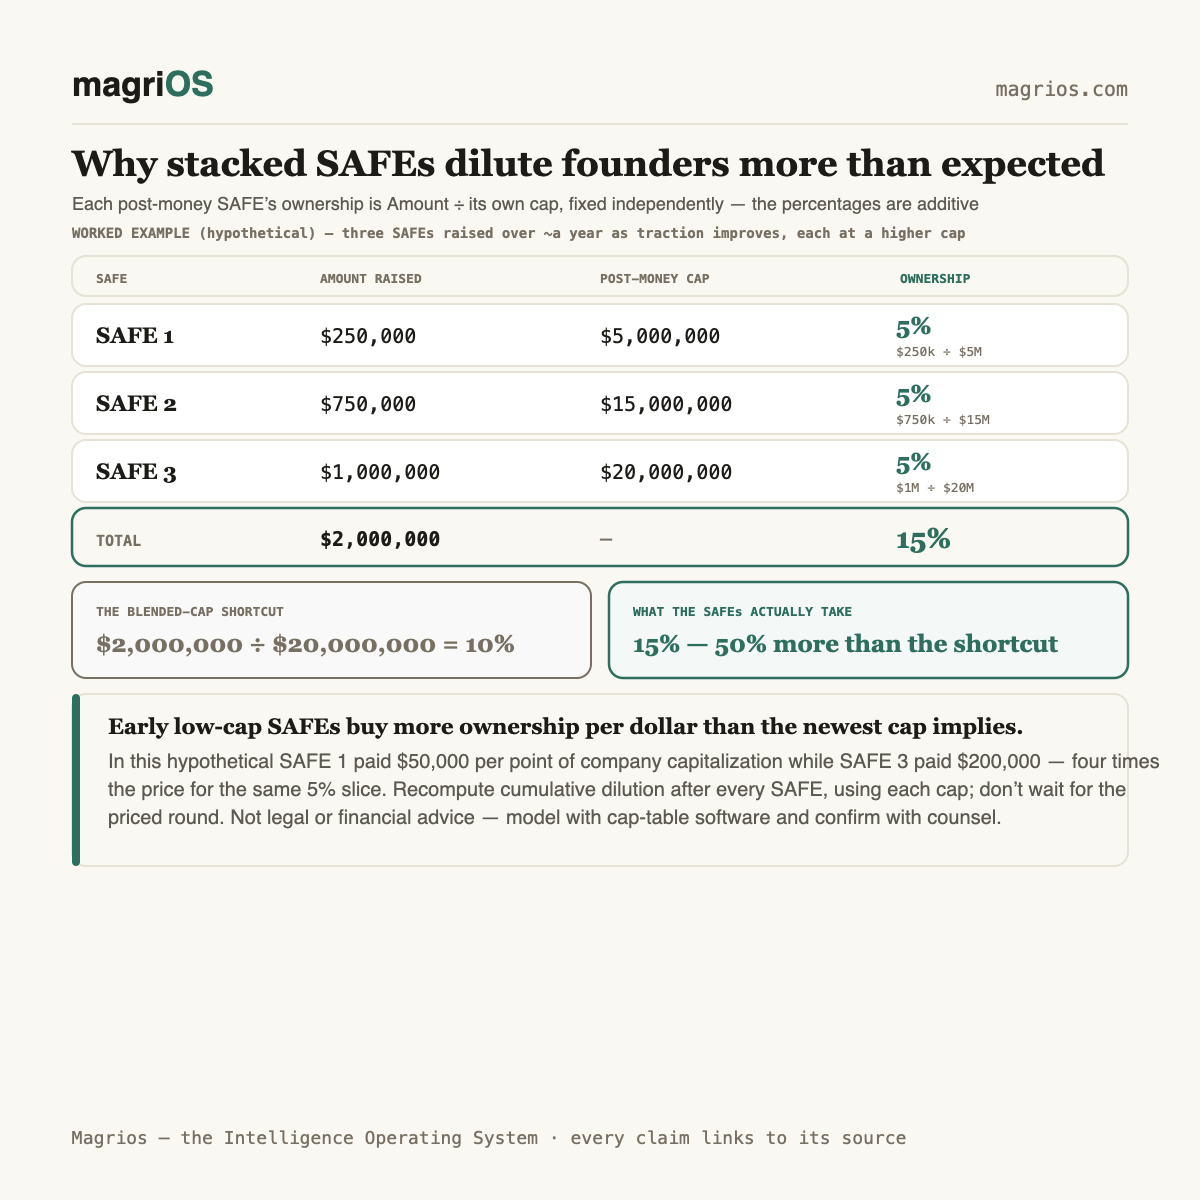
Stacking multiple SAFEs at different valuation caps dilutes founders more than the deal terms appear to suggest, because each post-money SAFE's ownership percentage is calculated independently against its own cap — not against the combined effect of every other SAFE outstanding. Founders who mentally net this out using the highest or most recent cap consistently underestimate their actual dilution, sometimes by a wide margin.
This describes standard mechanics for the YC-style post-money SAFE. It is general information, not legal or financial advice — actual conversion outcomes depend on the specific language in each SAFE and should be modeled with cap table software and confirmed with counsel.
How a post-money SAFE sets ownership
The mechanic that causes the surprise is simple on its own: for a standard post-money SAFE, ownership percentage (if the cap governs conversion) equals Purchase Amount ÷ Post-Money Valuation Cap. That percentage is fixed at the moment the SAFE is priced, calculated as if that SAFE alone were the only dilutive event happening.
The problem is what "as if it were the only dilutive event" means when you stack several of them: each SAFE's percentage doesn't get adjusted downward to account for the other SAFEs sitting alongside it. When they all convert together at the priced round, their percentages are additive — the founders' shares absorb the full combined total, not some smaller, netted-out amount.
Worked example: three stacked SAFEs (hypothetical)
Say a company raises three SAFEs over about a year, each at a different cap as the company's traction improves:
| SAFE | Amount raised | Post-money cap | Ownership if cap converts |
|---|---|---|---|
| SAFE 1 | $250,000 | $5,000,000 | $250,000 ÷ $5,000,000 = 5% |
| SAFE 2 | $750,000 | $15,000,000 | $750,000 ÷ $15,000,000 = 5% |
| SAFE 3 | $1,000,000 | $20,000,000 | $1,000,000 ÷ $20,000,000 = 5% |
| Total | $2,000,000 | — | 15% |
Total combined ownership implied by the three SAFEs is 5% + 5% + 5% = 15%.
Now compare that to the estimate a founder might make by eyeballing the total raised against the most recent (and highest) cap: $2,000,000 ÷ $20,000,000 = 10%. That "blended cap" estimate undercounts actual dilution by 5 percentage points — the real number is 50% higher than the naive estimate (15% vs. 10%).
Why the "blended cap" mental model fails
It's an intuitive shortcut: add up the money raised, divide by the cap everyone's currently talking about, and assume that's the dilution. It fails because each SAFE was priced at a different point in the company's life, at a cap that reflected the company's valuation then — not the valuation implied by the most recent round. The earlier, cheaper SAFEs bought more ownership per dollar precisely because they were priced when the company looked riskier. Averaging against the newest cap erases that difference and understates what the earlier investors are actually owed.
Carrying it through to the priced round (hypothetical, continued)
Suppose this same company later raises a Series A: $5,000,000 at a $20,000,000 pre-money valuation ($25,000,000 post-money), and the new investor requires a 10% post-financing option pool.
A tempting shortcut is to treat the SAFEs' 15% as a direct claim on the post-Series-A company and subtract everything from 100%. That is the wrong mechanic. A post-money SAFE's percentage is carved against company capitalization — the shareholder base as it stands immediately before the new money comes in — and the SAFE holders are then diluted by the priced round right alongside the founders. This is the same point made earlier: each SAFE's percentage is fixed at the moment the SAFE is priced, as a share of the company at conversion, not as a share of whatever the company becomes after the Series A.
This walkthrough uses the current YC post-money SAFE form, under which a new option pool created in connection with the financing is excluded from company capitalization — that convention applies to every figure below. Step by step:
- New Series A investor: $5,000,000 ÷ $25,000,000 = 20% of the post-round company.
- New option pool: 10% of the post-round company, per the term sheet.
- Pre-round holders — founders plus the converting SAFEs — keep the remainder: 100% − 20% − 10% = 70% of the post-round company.
- The stacked SAFEs' combined 15% applies to that pre-round block: 15% × 70% = 10.5% of the post-round company.
- Founders keep the rest of that block: 70% − 10.5% = 59.5% of the post-round company.
Check: 59.5% + 10.5% + 10% + 20% = 100%.
(If a particular SAFE's definition of company capitalization instead includes the new pool — some older or modified forms do, so check the document — the pre-round block is 80% rather than 70%: the SAFEs convert to 15% × 80% = 12% of the post-round company, and founders keep 80% − 12% − 10% = 58%. Under either convention, founders in this hypothetical land around 58-59.5% — never 55%, because subtracting the SAFEs' 15% straight off the post-round total ignores that the Series A dilutes the SAFE holders too.)
So where does stacking actually hurt? A founder who penciled in roughly 60% — say, 100% − 10% blended SAFE estimate − 20% − 10% = 60% — lands at 59.5% in this hypothetical, and the two mistakes in that shortcut nearly cancel. The real cost is the gap between what the blended-cap model says the SAFEs take and what they actually take. If the $2,000,000 in the worked example had genuinely bought the blended 10% of company capitalization, the SAFEs would convert to 10% × 70% = 7% of the post-round company and founders would keep 70% − 7% = 63%. Stacked at three separate caps, the SAFEs take 15% × 70% = 10.5% instead, so founders end at 59.5% rather than 63% — a 3.5-point loss on the post-Series-A cap table that traces entirely to the early, low-cap SAFEs buying more ownership per dollar than the newest cap suggests. In the worked example, SAFE 1 paid $250,000 ÷ 5 = $50,000 per percentage point of company capitalization while SAFE 3 paid $1,000,000 ÷ 5 = $200,000 per point — four times the price for the same slice.
Why this compounds with the option pool shuffle
The 10% pool top-up in that example isn't dilution-neutral either — where it's carved from (before or after the new money) determines whether the new investor shares in that cost or founders absorb it alone. See what is the option pool shuffle for the mechanics and a worked comparison. And once the SAFEs convert, their ownership becomes part of whatever preferred stock structure the priced round uses, which then determines what everyone actually receives at exit — see what is a liquidation preference stack.
How to model this before signing the next SAFE
- Recompute cumulative dilution after every SAFE, using each SAFE's own cap — don't wait until a priced round to add them up.
- Ask "what percentage of the company as it exists today does this represent," not "what percentage does this represent against your cap" — the two questions can have very different answers once other SAFEs are already outstanding.
- Use actual cap table software to model conversion rather than back-of-envelope math once more than one or two SAFEs are outstanding — the mechanics get harder to track by hand as terms (discounts, MFN clauses) vary between notes.
- If SAFEs are being used as bridge financing between priced rounds, understand why the bridge is needed in the first place — see bridge rounds versus priced rounds and what is burn multiple for how that financing decision usually gets made.
- Get counsel or a cap table platform to confirm the exact conversion math for your specific SAFE agreements before relying on any simplified percentage estimate, including the ones in this piece.
The percentages in a stack of SAFEs are simple to add up on their own. The discipline is doing that addition after every single one, not just once at the priced round when it's too late to renegotiate.